All the data on company trips, driver and customer activity, operators and payments is stored in reports.
There are 7 types of reports available for download on Company level that can be managed by Company users with Full and Finance & accounting accesses:
In order to export reports proceed to the Reports tab on Company level.
Choose “Add report” at the top right corner of the screen.
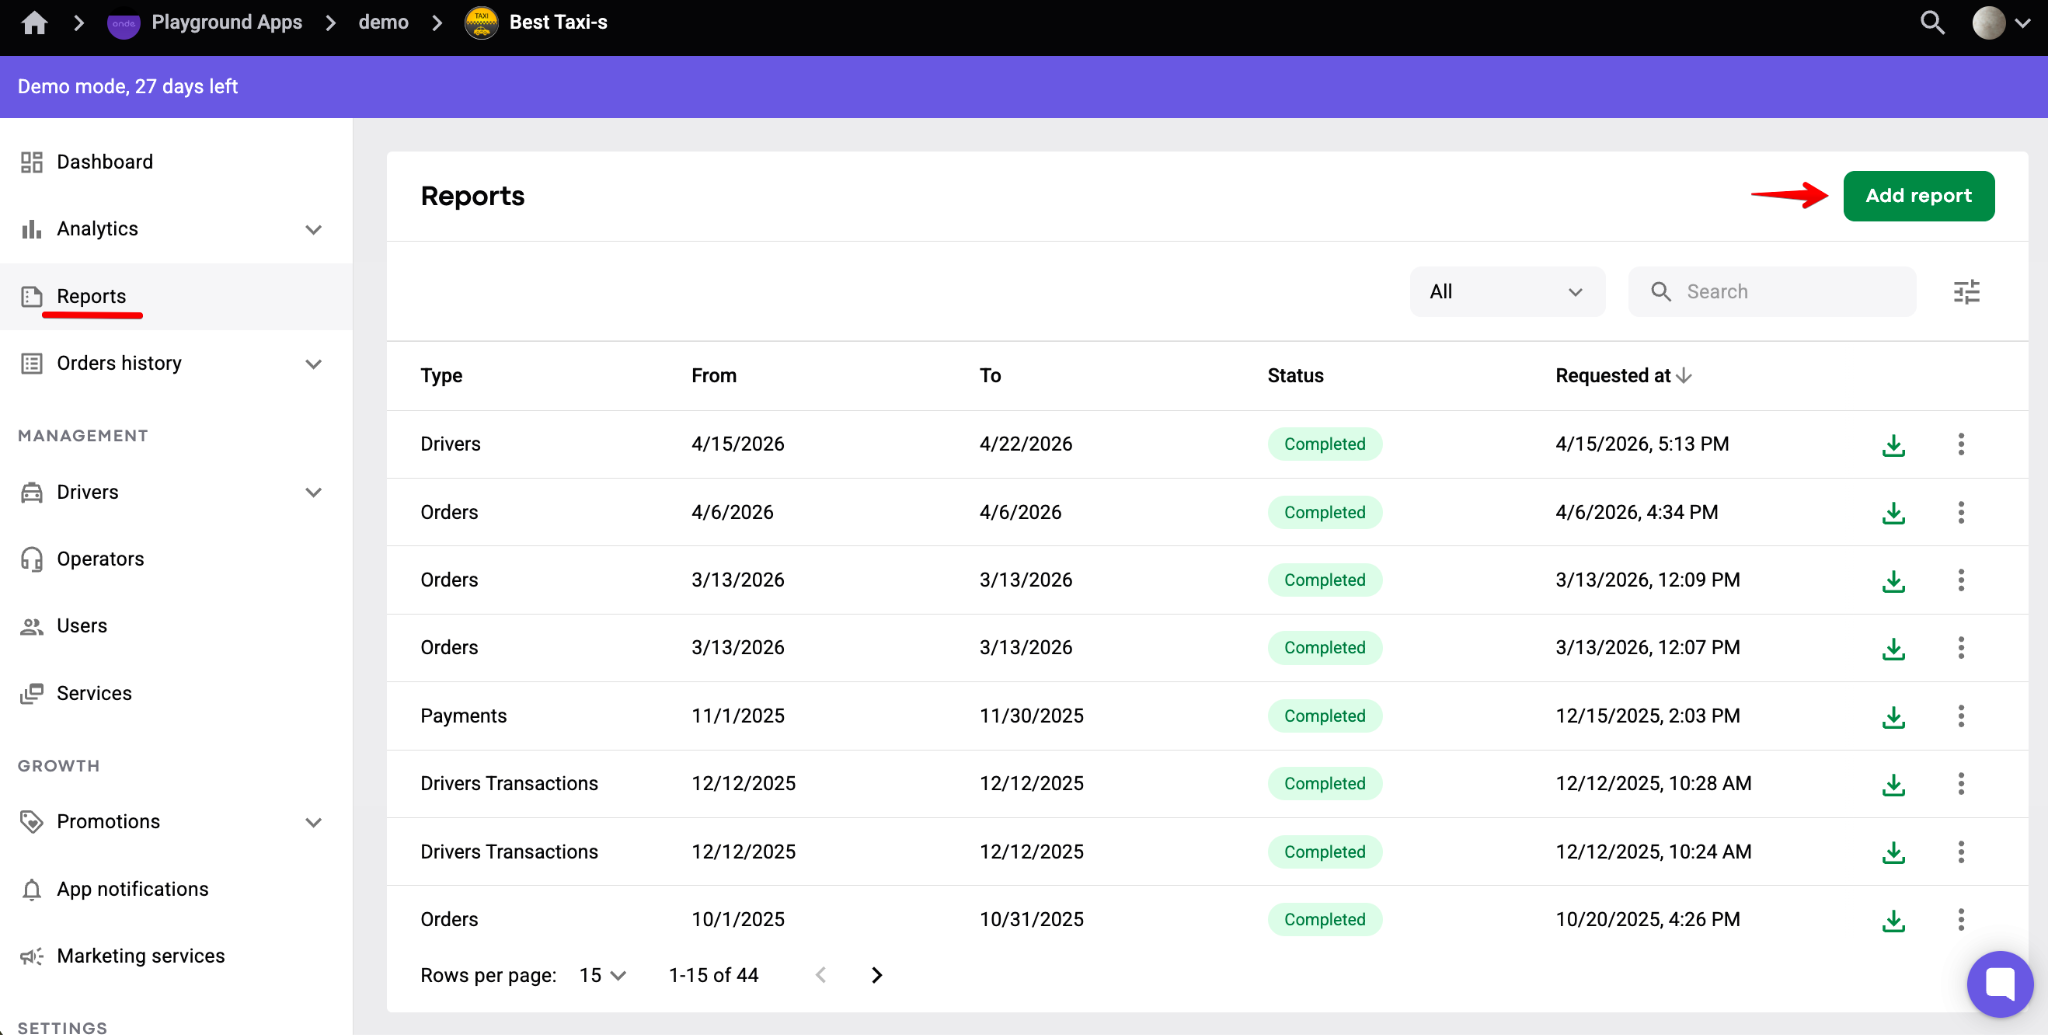
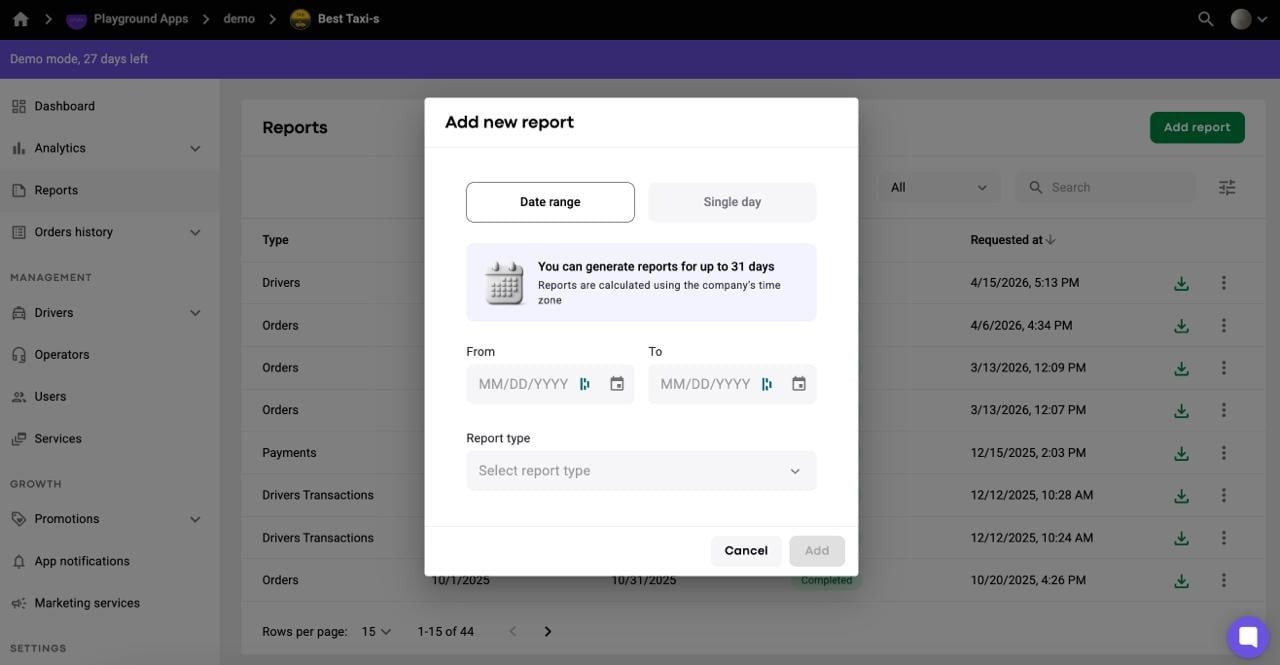
On the “Add new report” pop-up window specify:
1. Date range or Single day
2. Report type/s
Once that is done, just press “Add” and the report generation request will be submitted.
The requested report will appear in status “New”, then in status “In progress”. Give it some time and press “Refresh”. The report status should update for “Completed”.
If you have accidentally requested an extra report you can always void it by selecting “Cancel”.
There are 2 options to extract completed reports:
Direct download to your computer (Reports are downloaded to your computer in a CSV format and have to be opened in Excel. For steps to convert consult How to open a CSV file in Excel?)
Upload to Google drive (Choose the google account that you want your reports to be exported to and launch the upload. Uploaded reports can easily be opened and viewed in Excel).
Generated reports can be downloaded/uploaded one by one.
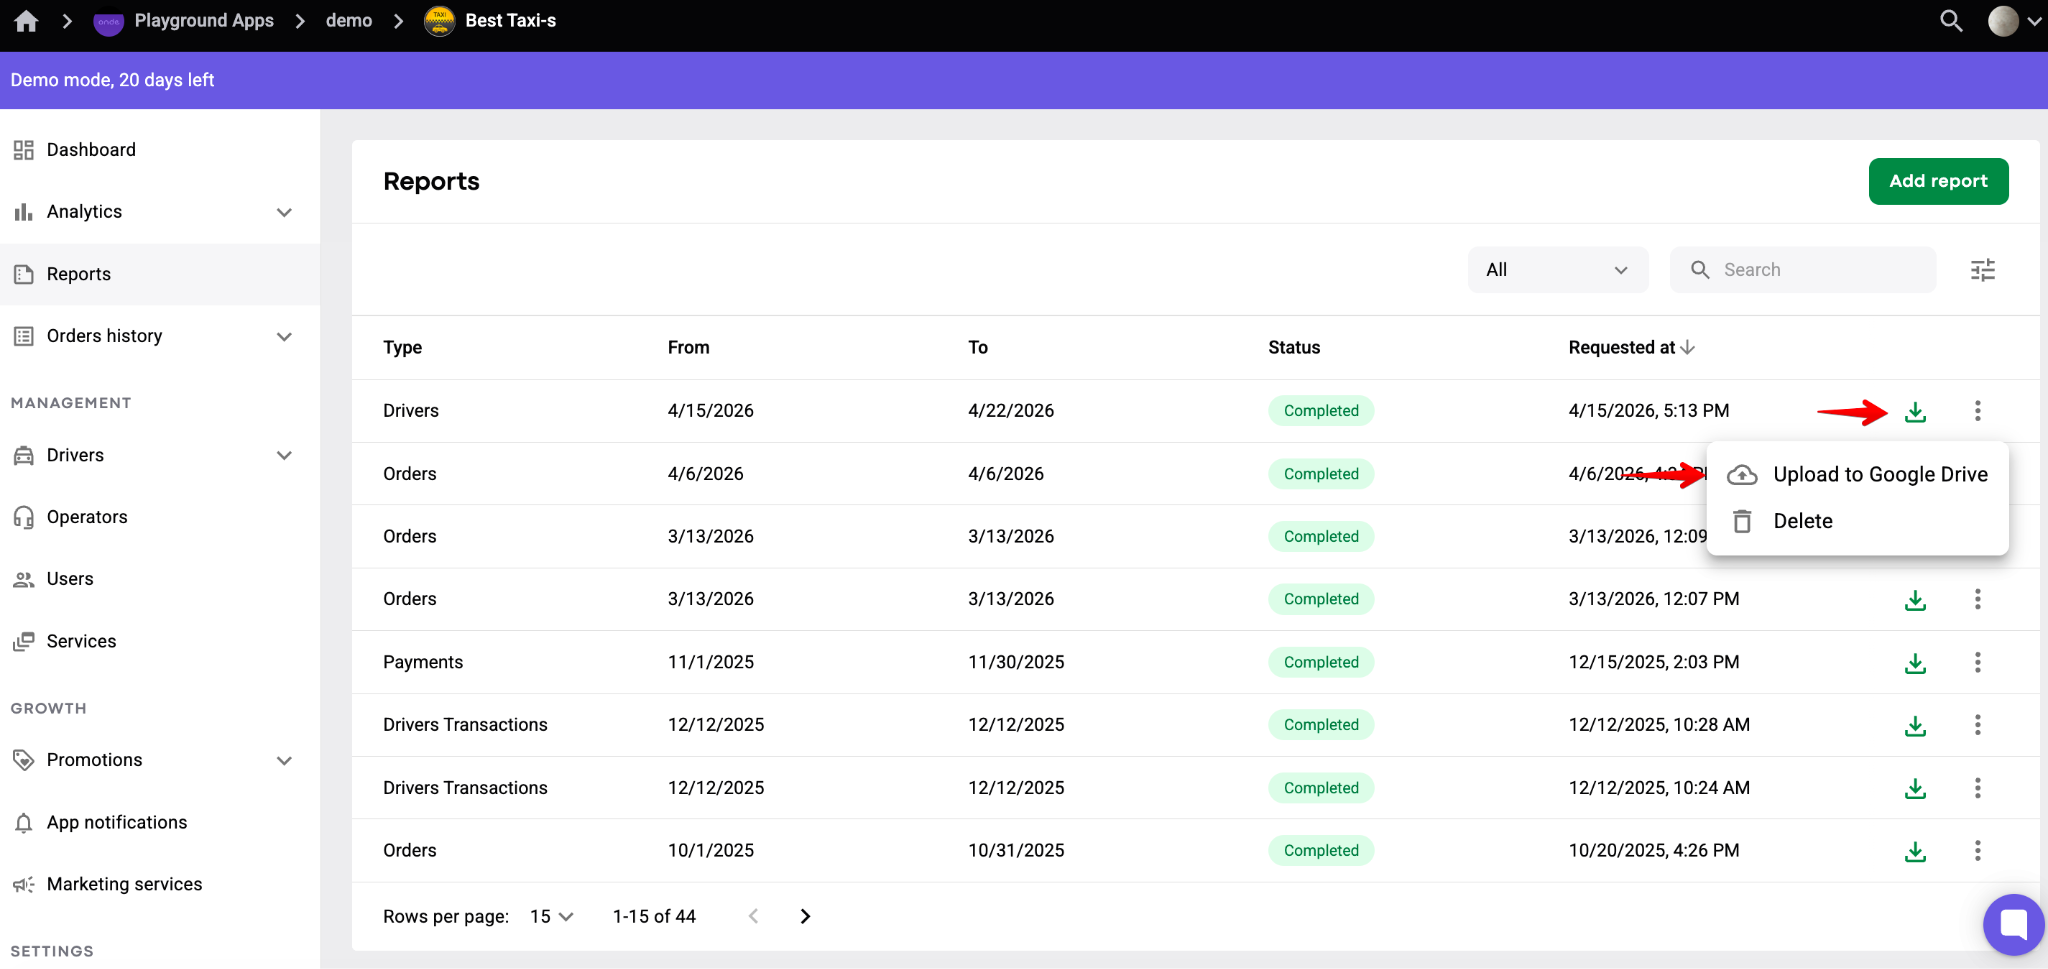
To download a generated report tap on the “Download” icon.
To upload a report to your drive tap on “More items button” and select “Upload to Google drive”.
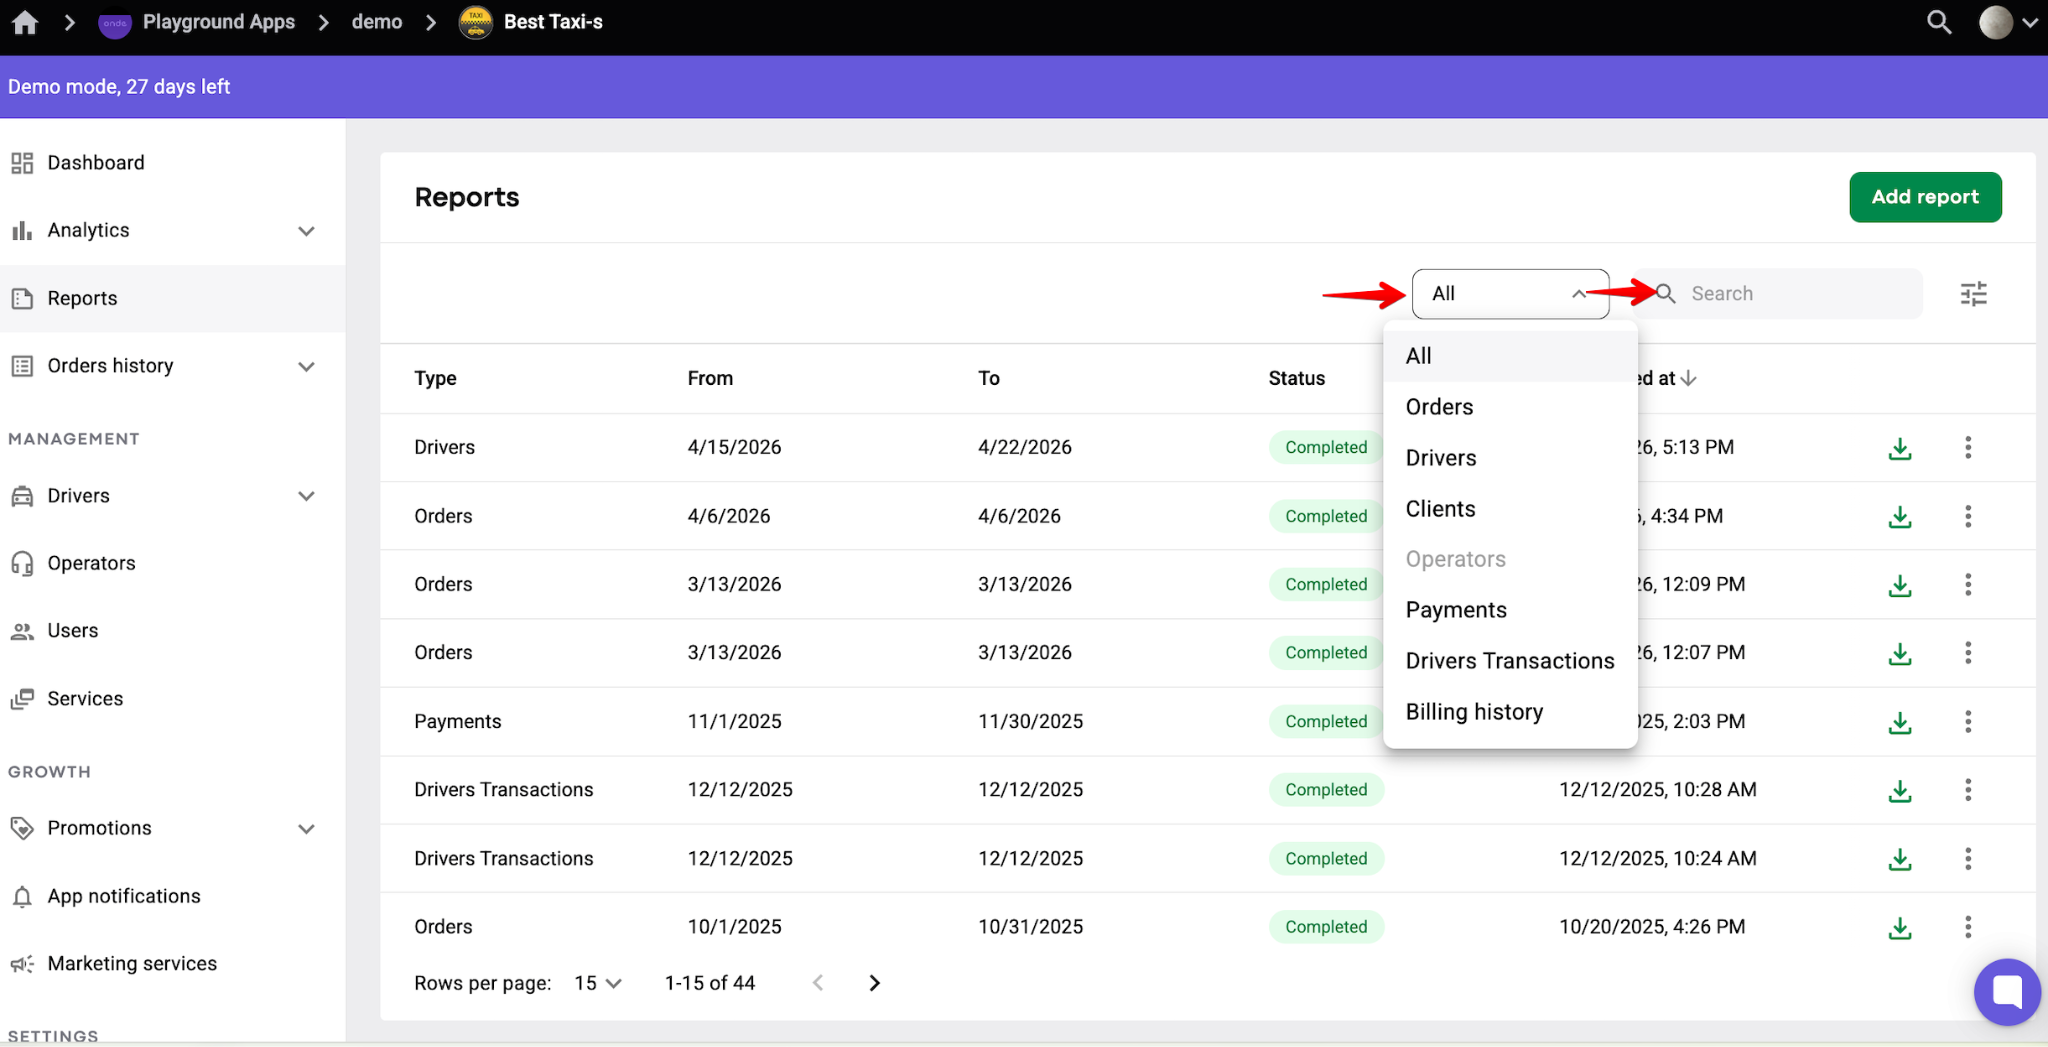
A generated report is stored in the tab "Reports" on the Company level and is searchable by Report type - select the necessary report type in the dropdown list.
Field “Search” works by Type and Status.
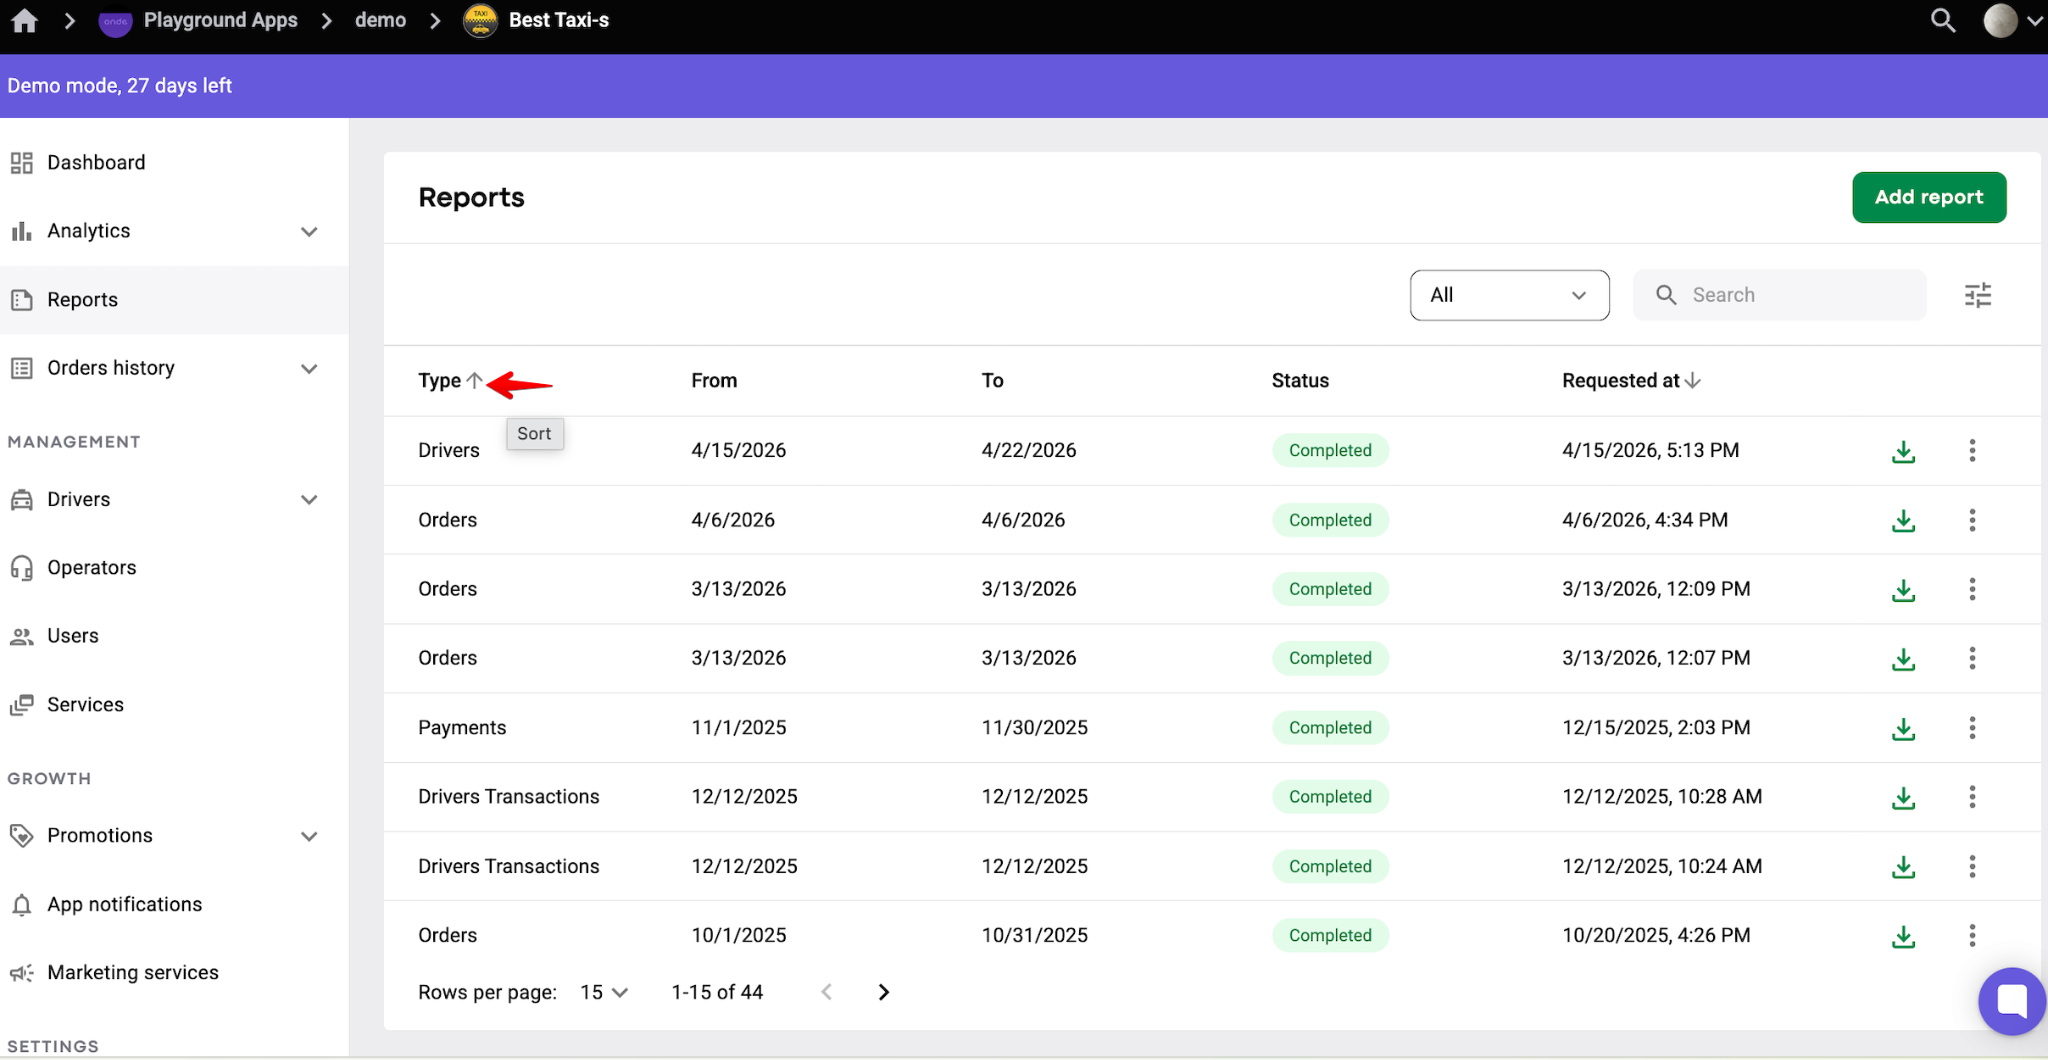
Reports can be sorted by any column value: Type/From/To/Status/Requested at.
Just hover over to the column Type for the arrow “Sort” to emerge.
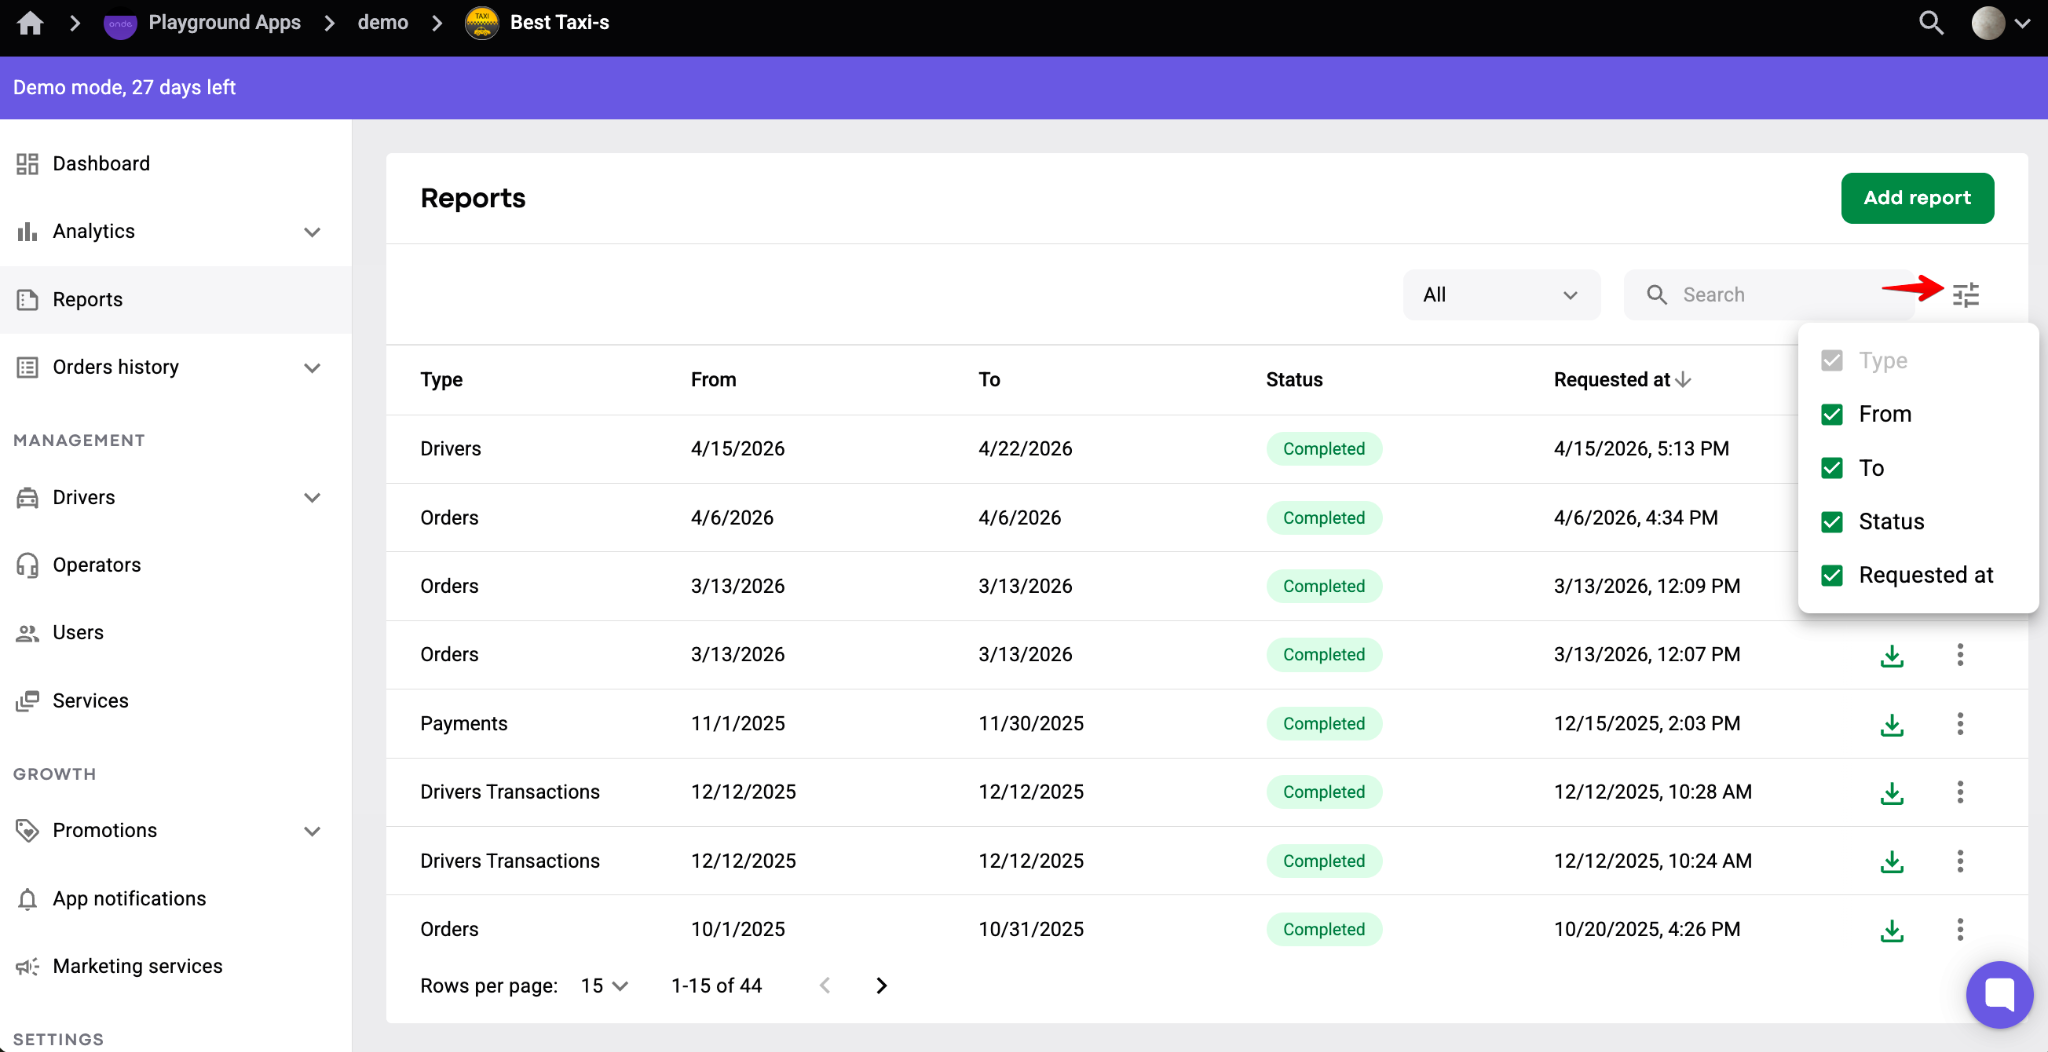
You can also use “Column chooser” to select/unselect report columns parameters to be visualized.
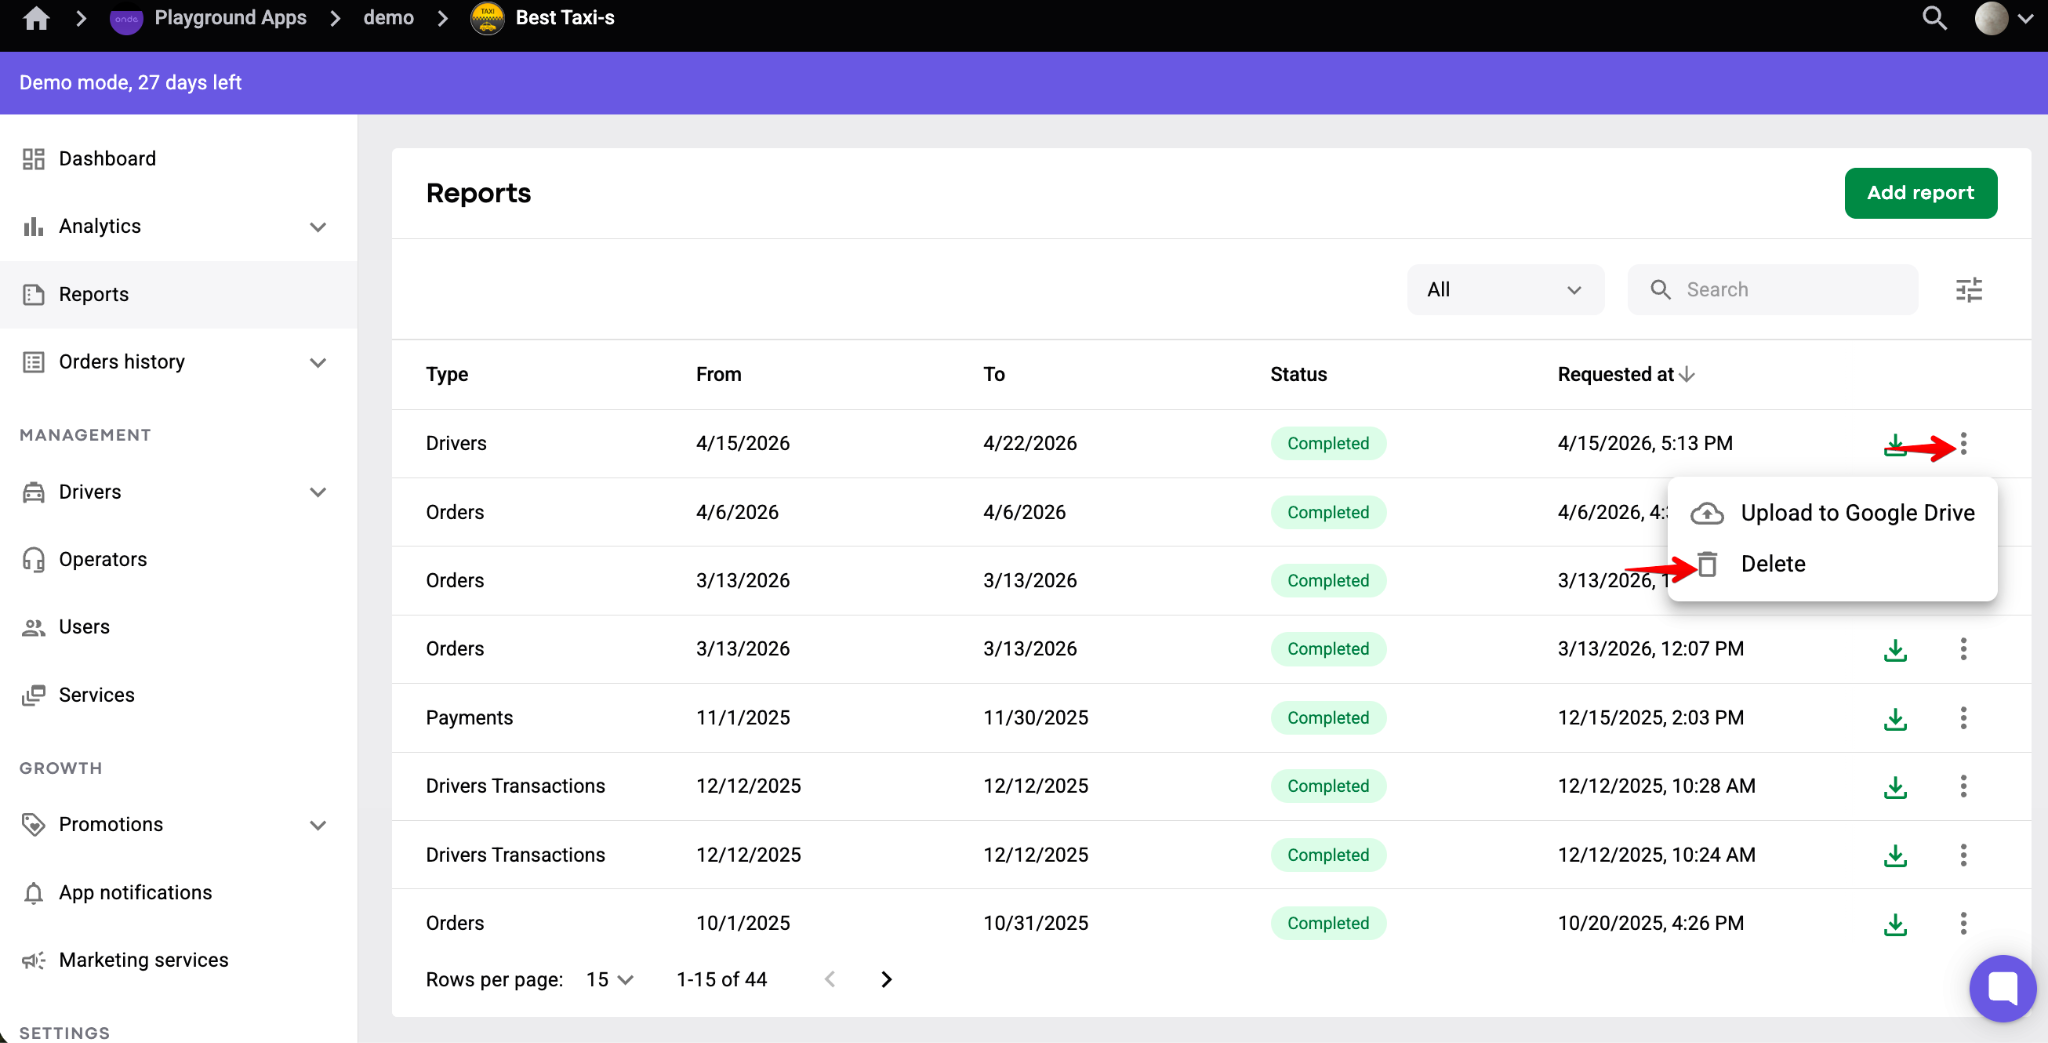
Once the report is successfully retrieved and there is no further need to store it in Company you can easily delete it. Just tap on the "more items" button next to the report and select “Delete”.
The navigation in reports is easy and smooth. Data is searchable by filters and manageable by any user familiar with standard Excel commands.
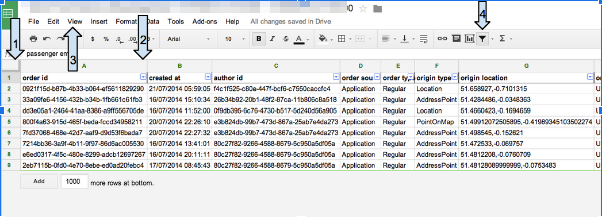
1. Click with the Cursor to #1 to select the whole table.
2. Put the cursor between the columns A and B, once the cursor is in black color, click twice, then the order of the columns and rows will be compatible.
3. In the option “View” select Freeze rows, then Freeze row 1.
4. To activate Filters click where the cursor #4 is pointing.
Check the article How to manage reports on Merchant level for details on managing reports by Merchant managers.
Good luck with managing your company data via reports!